 Tools
Tools
 Diagnostic Testing Accuracy: Sensitivity, Specificity, Predictive Values and Likelihood Ratios
Definition/Introduction
To make clinical decisions and guide patient care, providers must understand the likelihood that a patient has a disease, integrating pretest probability with diagnostic test results.[1] Diagnostic tools are routinely utilized in healthcare settings to determine treatment methods; however, many of these tools are subject to error.
Issues of Concern
Register For Free And Read The Full Article
 Search engine and full access to all medical articles
- 10 free questions in your specialty
- Free CME/CE Activities
- Free daily question in your email
- Save favorite articles to your dashboard
- Emails offering discounts
Learn more about a Subscription to StatPearls Point-of-Care
Issues of Concern
Benefits of Diagnostic Testing
The utilization of diagnostic tests in patient care settings must be guided by evidence. Unfortunately, many order tests without considering the evidence to support them.[1] Sensitivity and specificity are essential indicators of test accuracy and help healthcare providers assess the appropriateness of the diagnostic tool.[2] Providers should use diagnostic tests with appropriate confidence in the results, based on known sensitivity, specificity, positive predictive value (PPV), negative predictive value (NPV), positive likelihood ratio, and negative likelihood ratio.[2]
Diagnostic exam results are often presented in 2x2 tables. The values in this table can help determine sensitivity, specificity, positive predictive value, and likelihood ratios. A diagnostic test’s validity, or its ability to measure what it is intended to measure, is determined by sensitivity and specificity.[3] See Table. Diagnostic Testing Accuracy Table.
Sensitivity
Sensitivity is the proportion of true positive tests out of all patients with a condition.[4] In other words, it is the ability of a test or instrument to yield a positive result for a subject who has that disease.[2] The ability to correctly classify a test is essential, and the equation for sensitivity is the following:
Sensitivity=(True Positives (A))/(True Positives (A)+False Negatives (C))
Sensitivity does not allow providers to understand individuals who tested positive but did not have the disease.[5] False positives are a consideration when evaluating specificity and PPV.
Specificity
Specificity is the percentage of true negatives out of all subjects who do not have a disease or condition.[4] In other words, it is the ability of the test or instrument to obtain normal range or negative results for a person who does not have a disease.[2] The formula to determine specificity is the following:
Specificity=(True Negatives (D))/(True Negatives (D)+False Positives (B))
Sensitivity and specificity are inversely related: as sensitivity increases, specificity tends to decrease, and vice versa.[3][6] Highly sensitive tests yield positive results in patients with the disease, whereas highly specific tests show that patients without a positive result do not have the disease.[6] Sensitivity and specificity should always merit consideration together to provide a holistic picture of a diagnostic test.[7] Next, it is important to understand PPVs and NPVs.
PPV and NPV
PPVs determine, out of all of the positive findings, how many are true positives; NPVs determine, out of all of the negative findings, how many are true negatives. As the value increases toward 100, it approaches a ‘gold standard.’[3] The formulas for PPV and NPV are below.
Positive Predictive Value=(True Positives (A))/(True Positives (A)+False Positives (B))
Negative Predictive Value=(True Negatives (D))/(True Negatives (D)+False Negatives(C))
Disease prevalence in a population affects PPV and NPV. When a disease is highly prevalent, the test is better at ‘ruling in' the disease and worse at ‘ruling it out.’[1] Therefore, disease prevalence should also be considered when providers examine their diagnostic test metrics or interpret values from other providers or researchers. Providers should consider the sample when reviewing research that reports these values and recognize that the values in their population may differ.[5] Given the diagnostic test outputs, issues with results (eg, very low specificity) may prompt clinicians to reconsider clinical acceptability, and alternative diagnostic methods or tests should be considered.[8]
Likelihood Ratios
Likelihood ratios are another statistical tool for interpreting diagnostic tests. Likelihood ratios allow providers to determine how much a particular test's use changes the probability.[4] A positive likelihood ratio is the “probability that a positive test would be expected in a patient divided by the probability that a positive test would be expected in a patient without a disease.”[4] In other words, a positive likelihood ratio is the true positivity rate divided by the false positivity rate.[3] A negative likelihood ratio is “the probability of a patient testing negative who has a disease divided by the probability of a patient testing negative who does not have a disease.”[4] Unlike predictive values, and like sensitivity and specificity, likelihood ratios are not affected by disease prevalence.[9] The likelihood-ratio formulas are below.
Positive Likelihood Ratio=Sensitivity/(1-Specificity)
Negative Likelihood Ratio=(1- Sensitivity)/Specificity
Now that these topics have been covered completely, the application exercise calculates sensitivity, specificity, predictive values, and likelihood ratios.
Application Exercise
Example: A healthcare provider uses a blood test to determine whether patients have a disease.
The results are the following:
- A total of 1,000 individuals had their blood tested.
- Four hundred twenty-seven individuals had positive findings, and 573 individuals had negative findings.
- Of the 427 individuals with positive findings, 369 had the disease.
- Of the 573 individuals with negative findings, 558 did not have the disease.
Let’s calculate the sensitivity, specificity, PPV, NPV, positive likelihood ratio, and negative likelihood ratio. We first can start with a 2X2 Table. The information above allows us to enter the values in the table below. Notice that the values in the blue cells were not provided; however, we can derive them from the numbers above and the total cell utilization. See Image. Diagnostic Testing Accuracy Table 2.
The provider found that 384 individuals had the disease; how accurate was the blood test?
Results:
Sensitivity
- Sensitivity=(True Positives (A))/(True Positives (A)+False Negatives (C))
- Sensitivity=(369 (A))/(369(A)+15 (C))
- Sensitivity=369/384
- Sensitivity=0.961
Specificity
- Specificity=(True Negatives (D))/(True Negatives (D)+False Positives (B))
- Specificity=(558 (D))/(558(D)+58 (B))
- Specificity=558/616
- Specificity=0.906
Positive Predictive Value
- PPV =(True Positives (A))/(True Positives (A)+False Positives (B))
- PPV =(369 (A))/(369 (A)+58(B))
- PPV =369/427
- PPV =0.864
Negative Predictive Value
- NPV=(True Negatives (D))/(True Negatives (D)+False Negatives(C))
- NPV=(558(D))/(558 (D)+15(C))
- NPV=(558 )/573
- NPV=0.974
Positive Likelihood Ratio
- Positive Likelihood Ratio=Sensitivity/(1-Specificity)
- Positive Likelihood Ratio=0.961/(1-0.906)
- Positive Likelihood Ratio=0.961/0.094
- Positive Likelihood Ratio=10.22
- Negative Likelihood Ratio
- Negative Likelihood Ratio=(1- Sensitivity)/Specificity
- Negative Likelihood Ratio=(1- 0.961)/0.906
- Negative Likelihood Ratio=0.039/0.906
- Negative Likelihood Ratio=0.043
The results show a sensitivity of 96.1%, specificity of 90.6%, PPV of 86.4%, NPV of 97.4%, positive likelihood ratio of 10.22, and negative likelihood ratio of 0.043.
Clinical Significance
While other diagnostic test data techniques exist (eg, receiver operating characteristic curves), this topic serves as an essential starting point for healthcare providers. Diagnostic testing is a crucial component of evidence-based patient care. When determining whether to use a diagnostic test, providers should consider the test's benefits and risks, as well as its diagnostic accuracy.[1] With a foundational understanding of sensitivity, specificity, predictive values, and likelihood ratios, healthcare providers interpret outputs from current and new diagnostic assessments, aiding decision-making and ultimately improving patient care.
Nursing, Allied Health, and Interprofessional Team Interventions
All interprofessional healthcare team members need to understand these values as applied to diagnostic testing, so they can better analyze a patient's condition based on testing results. Any lack of understanding in this area can lead to misdiagnosis and suboptimal outcomes. Healthcare team members need to collaborate openly to facilitate proper diagnosis, leading to properly targeted therapeutic interventions.
Media
(Click Image to Enlarge)
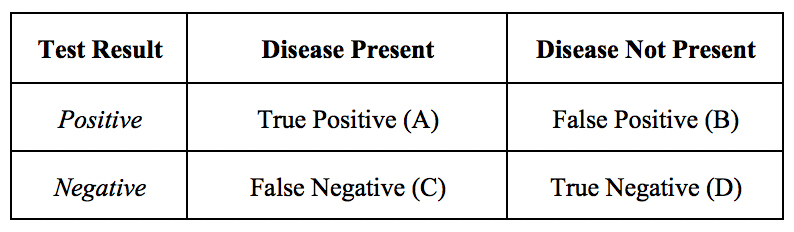
Diagnostic Testing Accuracy Table.
Contributed by M Huecker, MD, and J Shreffler, PhD
(Click Image to Enlarge)

Diagnostic Testing Accuracy Table 2
Contributed by M Huecker, MD, and J Shreffler, PhD
References
Bartol T. Thoughtful use of diagnostic testing: Making practical sense of sensitivity, specificity, and predictive value. The Nurse practitioner. 2015 Aug 15:40(8):10-2. doi: 10.1097/01.NPR.0000470366.64804.35. Epub [PubMed PMID: 26180907]
Glaros AG, Kline RB. Understanding the accuracy of tests with cutting scores: the sensitivity, specificity, and predictive value model. Journal of clinical psychology. 1988 Nov:44(6):1013-23 [PubMed PMID: 3216006]
Level 3 (low-level) evidenceParikh R, Mathai A, Parikh S, Chandra Sekhar G, Thomas R. Understanding and using sensitivity, specificity and predictive values. Indian journal of ophthalmology. 2008 Jan-Feb:56(1):45-50 [PubMed PMID: 18158403]
Level 3 (low-level) evidenceBolin E,Lam W, A review of sensitivity, specificity, and likelihood ratios: evaluating the utility of the electrocardiogram as a screening tool in hypertrophic cardiomyopathy. Congenital heart disease. 2013 Sep-Oct; [PubMed PMID: 23663480]
Akobeng AK. Understanding diagnostic tests 1: sensitivity, specificity and predictive values. Acta paediatrica (Oslo, Norway : 1992). 2007 Mar:96(3):338-41 [PubMed PMID: 17407452]
Level 3 (low-level) evidenceNaeger DM, Kohi MP, Webb EM, Phelps A, Ordovas KG, Newman TB. Correctly using sensitivity, specificity, and predictive values in clinical practice: how to avoid three common pitfalls. AJR. American journal of roentgenology. 2013 Jun:200(6):W566-70. doi: 10.2214/AJR.12.9888. Epub [PubMed PMID: 23701086]
Level 2 (mid-level) evidenceObuchowski NA, Bullen JA. Receiver operating characteristic (ROC) curves: review of methods with applications in diagnostic medicine. Physics in medicine and biology. 2018 Mar 29:63(7):07TR01. doi: 10.1088/1361-6560/aab4b1. Epub 2018 Mar 29 [PubMed PMID: 29512515]
Lachenbruch PA. Sensitivity, specificity, and vaccine efficacy. Controlled clinical trials. 1998 Dec:19(6):569-74 [PubMed PMID: 9875836]
Level 1 (high-level) evidenceParikh R, Parikh S, Arun E, Thomas R. Likelihood ratios: clinical application in day-to-day practice. Indian journal of ophthalmology. 2009 May-Jun:57(3):217-21. doi: 10.4103/0301-4738.49397. Epub [PubMed PMID: 19384017]