 Tools
Tools
 Mean
Mean
Definition/Introduction
The arithmetic mean, commonly termed the "average," is one of the most widely applied measures of central tendency in statistics and biomedical research. This quantity provides a single numerical value summarizing the central location of a set of quantitative observations and is frequently used to describe clinical, physiological, and laboratory data in medical studies. In practice, the mean functions as a foundational tool for condensing large datasets into interpretable forms, particularly in settings requiring rapid clinical decisions. Widespread use of this parameter reflects both simplicity and compatibility with numerous statistical methods commonly employed in biomedical research.[1][2]
Although "mean" and "average" are often used interchangeably in everyday language, the terms differ in statistical terminology. "Average" serves as a general descriptor that may indicate several measures of central tendency, including the arithmetic mean, median, or mode, depending on context (see Image. Measures of Central Tendency). In contrast, "mean" specifically denotes the arithmetic mean, calculated as the sum of all observations divided by the number of observations.[3]
To calculate the mean, all values in a dataset are summed and divided by the total number of values. Each term corresponds to an observation, and the denominator represents the total number of observations, as shown in the following equation:
Mean = (value1 + value2 + value3 + ... + last value) / number of values
For example, if a clinician records values of 80, 90, and 100, the mean is calculated by summing the values (80 + 90 + 100 = 270). Dividing this sum by 3 yields 90.
The mean is widely employed because it incorporates all observations in a dataset and facilitates direct comparison between groups, making it particularly useful in clinical research and epidemiology. Sensitivity to extreme values constitutes the primary limitation, as outliers can distort results and reduce the representativeness of the typical observation. This limitation is especially relevant in real-world clinical datasets, where variability and nonnormal distributions frequently occur. In such contexts, alternative measures such as the median may provide a more accurate summary of central tendency, and complementary measures of variability should be considered to achieve a comprehensive understanding of the data.[4]
Issues of Concern
Register For Free And Read The Full Article
 Search engine and full access to all medical articles
- 10 free questions in your specialty
- Free CME/CE Activities
- Free daily question in your email
- Save favorite articles to your dashboard
- Emails offering discounts
Learn more about a Subscription to StatPearls Point-of-Care
Issues of Concern
The arithmetic mean is widely employed due to its simplicity and interpretability. However, several issues require consideration when applying and reporting this parameter in clinical and research contexts. An important source of error is confusion between the arithmetic mean and other types of means, including the weighted, geometric, and harmonic means. Each measure is appropriate under specific conditions, and inappropriate use of the arithmetic mean can produce misleading conclusions, particularly when analyzing rates, ratios, or unequally weighted data.
A major limitation of the arithmetic mean is sensitivity to extreme values, also known as outliers. Incorporating every observation equally allows even a single unusually high or low value to substantially shift the mean away from the central tendency of most data. This effect is particularly pronounced in small samples or datasets with skewed distributions, which are common in biomedical research. In such cases, the mean may not accurately represent the typical value, and alternative measures, such as the median, may provide a more appropriate summary of central tendency.[5]
Closely related to this issue is the effect of skewed distributions. The mean shifts toward the tail in asymmetric datasets, reducing representativeness because extreme values exert a disproportionate influence. This effect is particularly pronounced in right-skewed distributions, which are common in biomedical data, where a small number of high values can elevate the mean above most individual observations (see Image. Effects of Skewed Data on Mean, Median, and Mode). For example, in variables such as income or hospital length of stay, extreme values can distort the mean and suggest a central value not experienced by the majority of individuals, whereas the median, being less affected by outliers, often provides a more accurate estimate of central tendency.[6][7]
Another concern involves the inappropriate use of the arithmetic mean with ordinal or categorical data. The mean assumes consistent and meaningful distances between values, a condition met by interval or ratio data (eg, temperature, weight, laboratory measurements) but not by ordinal scales. In ordinal datasets, such as Likert responses (eg, “mild,” “moderate,” “severe”) or clinical staging systems, categories have a logical order but unequal intervals. For example, the difference between “mild” and “moderate” symptoms may not equal the difference between “moderate” and “severe.” Calculating a mean under these conditions treats categories as if they were equally spaced numerical values, which can produce misleading or difficult-to-interpret results. In such cases, the median or mode provides a more appropriate summary of central tendency.[8]
The arithmetic mean is frequently reported without accompanying measures of variability, such as standard deviation or interquartile range, which limits interpretability. The mean describes only the central value of a dataset and provides no information about the distribution of values around it. Consequently, 2 datasets with identical means may differ substantially in dispersion, producing distinct clinical implications. For example, a dataset may be tightly clustered while another is widely spread, a difference not evident from the mean alone. Reporting measures of variability alongside the mean is essential for a more complete understanding of the data.[9][10]
The arithmetic mean can also obscure heterogeneity within a dataset. In diverse populations, a single mean value may conceal clinically relevant subgroup differences, particularly when underlying variability is substantial. Summarizing all observations into a central value can create the impression of uniformity, even when significant differences exist between subgroups, such as variations in treatment response or disease severity. This issue is particularly relevant in clinical research, where heterogeneity among patients is common and may directly affect prognosis and management. Reliance solely on the mean can produce oversimplified interpretations and obscure meaningful patterns, highlighting the importance of subgroup analyses or stratified approaches.[11]
This limitation manifests most clearly in multimodal or mixture distributions, where the arithmetic mean falls between distinct peaks rather than representing typical observations.[12] Such patterns—common in heterogeneous clinical data—produce oversimplified interpretations that subgroup analyses or mode identification can better resolve.
Censoring in time-to-event data limits the validity of the arithmetic mean because complete outcome times are not observed for all individuals. Right-censoring, common in survival and longitudinal studies, results in systematically incomplete data, causing the mean to be biased or not estimable when longer event times are disproportionately unobserved. This limitation has a substantial impact in clinical research domains, such as oncology and critical care, where survival endpoints are central, and follow-up is often incomplete. In such contexts, median survival and nonparametric estimators, including Kaplan–Meier methods, provide more appropriate and unbiased summaries of central tendency.[13]
The arithmetic mean assumes additive relationships and may be inappropriate for data generated by multiplicative or nonlinear processes. In fields such as pharmacokinetics, microbiology, and biomarker analysis, variables often follow log-normal distributions, where the arithmetic mean can be skewed by high values and fail to represent the typical observation.[14] This limitation affects both descriptive accuracy and downstream statistical inference, particularly when comparing treatment effects or biological responses. Geometric means or log-transformed analyses offer more appropriate summaries and improve interpretability in such contexts.
Clinical Significance
The arithmetic mean holds substantial clinical significance as a fundamental tool for summarizing and interpreting quantitative data in medical practice and research. This parameter provides a concise representation of central tendency, enabling rapid assessment of the overall behavior of a variable within a population. In clinical settings, the mean is routinely applied to laboratory values, vital signs, and physiological measurements, facilitating comparisons across patients, time points, or treatment groups. For example, mean hemoglobin levels, blood pressure, or serum creatinine values are commonly reported to assess baseline characteristics and monitor response to therapy.[15]
In clinical research, the mean serves a central role in study design, analysis, and interpretation. The mean is frequently used to compare outcomes between groups in randomized controlled trials, cohort studies, and observational analyses. Differences in means help determine intervention effectiveness, identify associations, and guide evidence-based decision-making. Many statistical tests commonly employed in biomedical research, including the t-test and analysis of variance (ANOVA), rely on comparisons of means, emphasizing their methodological importance.[16][17][18]
The mean is integral to the development of clinical guidelines and reference ranges. Many diagnostic thresholds and normal values are derived from population averages, often reported alongside measures of variability. For example, laboratory reference intervals are typically established using the mean and standard deviation from healthy populations, enabling the identification of abnormal results and supporting diagnostic decisions. Similarly, mean values are applied in epidemiological studies to estimate disease burden, monitor trends, and inform public health strategies.[19]
The role of the mean continues to evolve in the era of precision medicine. Although individualized approaches emphasize patient-specific variability, population-level summaries, such as the mean, remain essential for establishing general patterns, benchmarking outcomes, and guiding initial clinical decisions. The arithmetic mean serves as a bridge between raw data and clinical insight, supporting both routine practice and the advancement of medical knowledge.
Nursing, Allied Health, and Interprofessional Team Interventions
Appropriate use and interpretation of the mean in clinical settings require coordinated efforts among physicians, advanced practitioners, nurses, pharmacists, and allied health professionals to ensure accurate, patient-centered care. As a frequently reported statistical measure, the mean influences clinical decision-making, guideline interpretation, and communication of patient data. However, the limitations of this central measure demand a shared understanding across the interprofessional team. Clinicians must possess the skills to interpret the mean in context, recognizing when it accurately reflects a patient population and when alternative measures, such as the median or range, are more appropriate.
Physicians and advanced practitioners hold primary responsibility for integrating statistical data into clinical decision-making. Responsibilities include critical appraisal of research studies, understanding the reporting of outcomes, and applying this knowledge to individual patients. Recognition of situations in which mean values may be misleading due to skewed distributions or heterogeneity within study populations is essential. Ethical practice requires transparency in communicating these nuances to patients, particularly when discussing prognosis, expected outcomes, or treatment benefits derived from population-level data.[20]
Nurses contribute substantially by monitoring patient responses and detecting variability not captured by average values. Continuous patient assessment enables the identification of deviations from expected “average” outcomes, prompting timely communication with the care team. The role in patient education is also critical, as nurses translate complex clinical information into understandable terms, assisting patients in contextualizing statistics such as “average recovery time” or “mean treatment response.”[21]
Pharmacists perform an essential function in interpreting and applying mean-based data in pharmacotherapy. Many dosing recommendations, therapeutic ranges, and pharmacokinetic parameters are derived from mean values reported in clinical studies. Individual patient factors, including renal function, age, and comorbidities, may cause deviations from these averages. Pharmacist expertise is vital for preventing medication-related harm that could result from indiscriminate application of population means.[22]
Allied health professionals, including laboratory personnel, epidemiologists, and therapists, rely heavily on the mean in their respective domains. Laboratory specialists establish and validate reference ranges that guide clinical interpretation, while epidemiologists apply mean values to monitor population health trends. Physical and occupational therapists may use mean functional scores to benchmark patient progress but must tailor care plans to individual patient factors.[23]
Effective interprofessional communication ensures consistent and appropriate interpretation of the mean across the care team. Team discussions, clinical rounds, and shared documentation should include not only mean values but also relevant measures of variability and contextual information. This approach promotes a comprehensive understanding of patient data and reduces the risk of misinterpretation. Fostering a culture of statistical literacy within healthcare teams further enhances overall performance and patient safety.[24]
Care coordination is particularly critical during transitions between levels of care, where reliance on summary statistics may oversimplify complex clinical situations. Clear communication regarding the meaning and limitations of the mean supports continuity and accuracy in patient management. The interprofessional team must balance the utility of the mean as a summary measure with the need for individualized, nuanced care, ensuring that statistical interpretation aligns with the principles of patient-centered practice.[25][26]
Media
(Click Image to Enlarge)
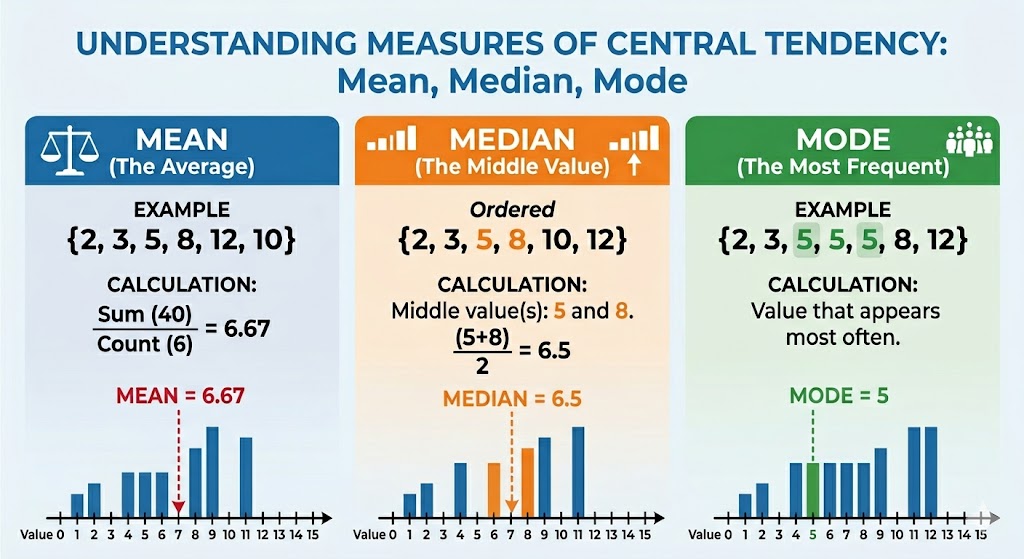
Measures of Central Tendency. This illustration compares the mean, median, and mode. Each panel presents a mathematical example alongside a number line and bar chart to demonstrate differences in data distribution and central positioning.
Contributed by StatPearls
(Click Image to Enlarge)
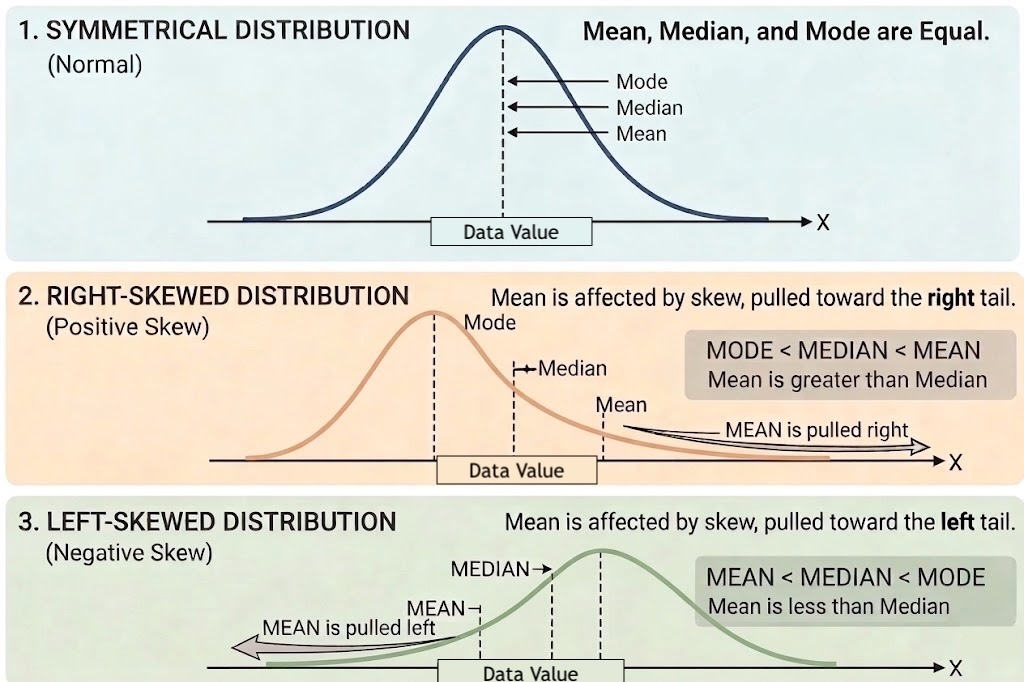
Effects of Skewed Data on Mean, Median, and Mode. The figure compares symmetrical, right-skewed, and left-skewed distributions to illustrate how skewness alters the relative positions of the mean, median, and mode.
Contributed by StatPearls
References
Whitley E, Ball J. Statistics review 1: presenting and summarising data. Critical care (London, England). 2002 Feb:6(1):66-71 [PubMed PMID: 11940268]
Manovic A, Immelsjö E, Axen I, Palmgren PJ. Reporting the standard error of the mean: a critical analysis of three journals in manual medicine. Chiropractic & manual therapies. 2025 Jun 4:33(1):23. doi: 10.1186/s12998-025-00587-y. Epub 2025 Jun 4 [PubMed PMID: 40468335]
Cardinal LJ. Central tendency and variability in biological systems. Journal of community hospital internal medicine perspectives. 2015:5(3):27930. doi: 10.3402/jchimp.v5.27930. Epub 2015 Jun 15 [PubMed PMID: 26091665]
Level 3 (low-level) evidenceManikandan S. Measures of central tendency: The mean. Journal of pharmacology & pharmacotherapeutics. 2011 Apr:2(2):140-2. doi: 10.4103/0976-500X.81920. Epub [PubMed PMID: 21772786]
Streiner DL. Do you see what I mean? Indices of central tendency. Canadian journal of psychiatry. Revue canadienne de psychiatrie. 2000 Nov:45(9):833-6 [PubMed PMID: 11143834]
Gonzales VA, Ottenbacher KJ. Measures of central tendency in rehabilitation research: what do they mean? American journal of physical medicine & rehabilitation. 2001 Feb:80(2):141-6 [PubMed PMID: 11212015]
Lee AH, Fung WK, Fu B. Analyzing hospital length of stay: mean or median regression? Medical care. 2003 May:41(5):681-6 [PubMed PMID: 12719692]
Jankowski KR, Flannelly KJ. Measures of central tendency in chaplaincy, health care, and related research. Journal of health care chaplaincy. 2015:21(1):39-49. doi: 10.1080/08854726.2014.989799. Epub [PubMed PMID: 25569781]
Vetter TR. Descriptive Statistics: Reporting the Answers to the 5 Basic Questions of Who, What, Why, When, Where, and a Sixth, So What? Anesthesia and analgesia. 2017 Nov:125(5):1797-1802. doi: 10.1213/ANE.0000000000002471. Epub [PubMed PMID: 28891910]
Green DJ, Campbell MJ, Koutoumanou E. When means and standard deviations are an incomplete summary of a continuous variable: problems, solutions, and utilising the reference ranges to check normality. BMJ medicine. 2026:5(1):e001796. doi: 10.1136/bmjmed-2025-001796. Epub 2026 Feb 4 [PubMed PMID: 41658050]
Cordero CP, Dans AL. Key concepts in clinical epidemiology: detecting and dealing with heterogeneity in meta-analyses. Journal of clinical epidemiology. 2021 Feb:130():149-151. doi: 10.1016/j.jclinepi.2020.09.045. Epub [PubMed PMID: 33483004]
Panagiotopoulou K, Evrenoglou T, Schmid CH, Metelli S, Chaimani A. Meta-analysis models relaxing the random-effects normality assumption: methodological systematic review and simulation study. BMC medical research methodology. 2025 Oct 16:25(1):231. doi: 10.1186/s12874-025-02658-3. Epub 2025 Oct 16 [PubMed PMID: 41102684]
Level 1 (high-level) evidenceDudley WN, Wickham R, Coombs N. An Introduction to Survival Statistics: Kaplan-Meier Analysis. Journal of the advanced practitioner in oncology. 2016 Jan-Feb:7(1):91-100 [PubMed PMID: 27713848]
Motulsky HJ, Head T, Clarke PBS. Analyzing lognormal data: A nonmathematical practical guide. Pharmacological reviews. 2025 May:77(3):100049. doi: 10.1016/j.pharmr.2025.100049. Epub 2025 Feb 25 [PubMed PMID: 40153903]
Vetter TR. Fundamentals of Research Data and Variables: The Devil Is in the Details. Anesthesia and analgesia. 2017 Oct:125(4):1375-1380. doi: 10.1213/ANE.0000000000002370. Epub [PubMed PMID: 28787341]
Bland JM, Altman DG. The use of transformation when comparing two means. BMJ (Clinical research ed.). 1996 May 4:312(7039):1153 [PubMed PMID: 8620137]
Rivas-Ruiz R, Pérez-Rodríguez M, Talavera JO. [Clinical research XV. From the clinical judgment to the statistical model. Difference between means. Student's t test]. Revista medica del Instituto Mexicano del Seguro Social. 2013 May-Jun:51(3):300-3 [PubMed PMID: 23883459]
Chicco D, Sichenze A, Jurman G. A simple guide to the use of Student's t-test, Mann-Whitney U test, Chi-squared test, and Kruskal-Wallis test in biostatistics. BioData mining. 2025 Aug 20:18(1):56. doi: 10.1186/s13040-025-00465-6. Epub 2025 Aug 20 [PubMed PMID: 40835959]
Shine B. Use of routine clinical laboratory data to define reference intervals. Annals of clinical biochemistry. 2008 Sep:45(Pt 5):467-75. doi: 10.1258/acb.2008.008028. Epub [PubMed PMID: 18753418]
Kent DM, Rothwell PM, Ioannidis JP, Altman DG, Hayward RA. Assessing and reporting heterogeneity in treatment effects in clinical trials: a proposal. Trials. 2010 Aug 12:11():85. doi: 10.1186/1745-6215-11-85. Epub 2010 Aug 12 [PubMed PMID: 20704705]
Melnyk BM, Gallagher-Ford L, Long LE, Fineout-Overholt E. The establishment of evidence-based practice competencies for practicing registered nurses and advanced practice nurses in real-world clinical settings: proficiencies to improve healthcare quality, reliability, patient outcomes, and costs. Worldviews on evidence-based nursing. 2014 Feb:11(1):5-15. doi: 10.1111/wvn.12021. Epub 2014 Jan 21 [PubMed PMID: 24447399]
Level 2 (mid-level) evidenceLu AY. Drug-metabolism research challenges in the new millennium: individual variability in drug therapy and drug safety. Drug metabolism and disposition: the biological fate of chemicals. 1998 Dec:26(12):1217-22 [PubMed PMID: 9860931]
Horn PS, Pesce AJ. Reference intervals: an update. Clinica chimica acta; international journal of clinical chemistry. 2003 Aug:334(1-2):5-23 [PubMed PMID: 12867273]
Reeves S, Perrier L, Goldman J, Freeth D, Zwarenstein M. Interprofessional education: effects on professional practice and healthcare outcomes (update). The Cochrane database of systematic reviews. 2013 Mar 28:2013(3):CD002213. doi: 10.1002/14651858.CD002213.pub3. Epub 2013 Mar 28 [PubMed PMID: 23543515]
Level 1 (high-level) evidenceColeman EA, Boult C, American Geriatrics Society Health Care Systems Committee. Improving the quality of transitional care for persons with complex care needs. Journal of the American Geriatrics Society. 2003 Apr:51(4):556-7 [PubMed PMID: 12657079]
Level 2 (mid-level) evidenceHosseinzadeh E, Afkanpour M, Momeni M, Tabesh H. Data quality assessment in healthcare, dimensions, methods and tools: a systematic review. BMC medical informatics and decision making. 2025 Aug 9:25(1):296. doi: 10.1186/s12911-025-03136-y. Epub 2025 Aug 9 [PubMed PMID: 40783704]
Level 1 (high-level) evidence