 Tools
Tools
 ECG T Wave
Introduction
Each electrocardiogram (ECG) tracing component conveys critical information about cardiac function. Each wave and segment of the ECG corresponds to a phase of the cardiac cycle. (See Image. Normal Sinus Rhythm on Electrocardiography). The cardiac electrical cycle begins with generating action potentials by pacemaker cells in the sinoatrial node in the right atrium. These action potentials travel via gap junctions and the Bachmann bundle throughout the right and left atria. The signals from the right atrium reach the atrioventricular node, which modulates the signal transmission rate to the bundle of His in the interventricular septum. The electrical impulse is then carried by Purkinje fibers to the ventricular walls, stimulating contraction of the ventricles (ventricular systole). This contraction is followed by ventricular diastole, during which the myocardium relaxes and the myocardial cells repolarize. The T wave on the ECG represents this final phase.[1][2]
Normal T-wave findings are characterized by positive deflections in all leads except aVR and V1; however, their morphology may be altered by various physiologic and pathologic processes (See Image. T-Wave Morphology). The shape and size of the T wave are influenced by anatomical, metabolic, hormonal, neurological, hematological, and toxicological factors. Pathologic T waves may appear peaked, flattened, inverted, or biphasic, and specific disease processes are associated with pathognomonic T-wave morphologies. Recognition of these patterns is critical for the timely diagnosis and treatment of the underlying pathology.
Etiology
Register For Free And Read The Full Article
 Search engine and full access to all medical articles
- 10 free questions in your specialty
- Free CME/CE Activities
- Free daily question in your email
- Save favorite articles to your dashboard
- Emails offering discounts
Learn more about a Subscription to StatPearls Point-of-Care
Etiology
The Normal T Wave
The normal T wave represents vectors of electrical activity associated with ventricular repolarization. Ventricular repolarization is the process of ventricular myocytes returning to their negative resting membrane potential before the arrival of the next action potential. This period roughly corresponds to ventricular diastole.
Normal T waves are upright in leads I, II, and V through V6, inverted in aVR, and of variable orientation in V1 and V2. They are less than 5 mm in limb leads, less than 10 mm in precordial leads, and have a variable size in leads III, aVL, aVF, and V1 through V2.[2] Variations from this pattern may occur due to factors such as patient age, cardiac orientation, or underlying disease.
Abnormal T Waves
Abnormal T waves vary from standard patterns in size, shape, or orientation. Careful attention to the distribution of T-wave abnormalities on the ECG is critical because systemic processes are more likely to cause diffuse abnormalities. In contrast, pathology such as pulmonary embolism and myocardial ischemia typically causes localized abnormalities consistent with a specific territory of myocardium. Illicit substances and certain classes of medication may also alter T-wave morphology.
Hyperacute T waves
Tall, or hyperacute, T waves may represent myocardial ischemia or infarction. T waves begin to broaden and peak within 30 minutes of complete coronary artery occlusion and may be the earliest sign of myocardial infarction on ECG. Hyperacute T waves representing myocardial infarction are seen in the leads corresponding to the affected coronary artery.[1]
The term hyperacute T wave lacks a standardized definition, but it is commonly described as an increase in the area under the curve of the T wave relative to the preceding QRS complex.[3] Typically, the term is used only in cases of T-wave enlargement in the setting of ischemic heart disease. Tall T waves are also seen in cases of ventricular hypertrophy or as a normal variant. Tall T waves may also be a normal variation in young patients and athletes, particularly in leads V2 through V4.[4] Comparison with prior ECGs and correlation with the patient's overall presentation are critical for discerning whether tall T waves represent critical pathology or benign normal variation.
Peaked T waves
Peaked T waves are tall, narrow, and symmetrical and are associated with hyperkalemia. They tend to be narrower than the hyperacute T waves in myocardial ischemia. The degree of hyperkalemia does not necessarily correlate with the height of the T wave. As hyperkalemia progresses, other ECG abnormalities may develop, including P-wave flattening, widening of the QRS complex, and prolonging the PR interval.[5][6]
Inverted T waves
T-wave inversion has many potential etiologies, the most critical of which is myocardial ischemia.[5] Interrupted perfusion to the myocardial tissue disturbs the typical pattern of ventricular repolarization. A special case of T-wave inversion due to myocardial ischemia is type A Wellens syndrome, in which severe narrowing of the proximal left anterior descending artery causes large, symmetrically inverted T waves in the anterior precordial leads (See Image. Wellens Syndrome). This pattern represents 75% of Wellens syndrome cases and is considered a form of acute coronary syndrome that is treated as an acute myocardial infarction. Please see StatPearls' companion resource, "Wellens Syndrome," for further information.[7]
Other cardiopulmonary pathologies may cause T-wave inversion. Patients with inflammatory or infectious pericarditis and myocarditis may have inverted T waves on ECG.[8] Massive pulmonary embolism or pulmonary hypertension may cause T-wave inversion due to ventricular strain or hypertrophy (See Image. Right Ventricular Hypertrophy Electrocardiography). A left bundle branch block also causes the T wave to deflect opposite the QRS complex.
Diffuse, deep, symmetrically inverted T waves called cerebral T waves may be seen in a severe central nervous system injury, including ischemic stroke, intracranial bleeding, and traumatic brain injury.[5] T-wave inversions have also been reported in the setting of acute upper abdominal pathology such as perforated gastric ulcer, pancreatitis, and acute hepatobiliary diseases.[9] Furthermore, physiologic, benign T-wave inversion may be noted in anterior (rarely, in inferolateral leads) children younger than 14 due to right ventricular dominance. Young athletes may have T-wave inversions in certain leads, with the specific distribution correlating with the relative risk of underlying structural heart disease.[10]
Memory T waves, also known as cardiac memory, refer to persistent T-wave inversion after abnormal ventricular activation, such as ventricular pacing or ventricular tachycardia. These T-wave changes represent the adaptive electrical response to previous abnormal conduction patterns. Although cardiac memory is a harmless and reversible phenomenon, it is clinically significant because it can mimic more serious conditions such as myocardial ischemia or infarction, potentially leading to misdiagnosis.[11]
Biphasic T waves
Biphasic T waves contain a positive and a negative deflection relative to the ECG baseline. The primary causes of biphasic T waves are myocardial ischemia and hypokalemia. Typically, the initial deflection is positive in ischemia and negative in hypokalemia. Type B Wellens syndrome (25% of cases) is associated with biphasic T waves in the precordial leads due to critical stenosis or occlusion of the left anterior descending artery; it is also treated as an acute myocardial infarction.[12]
Epidemiology
The prevalence of T-wave abnormalities on baseline ECGs in the general population is typically low, as ECGs are usually performed in symptomatic individuals or those with known or suspected cardiac disease. Abnormal ECGs are generally more common in older adults and those with comorbid conditions such as congenital or structural heart disease, atherosclerotic cardiovascular disease, diabetes, and chronic pulmonary disease. Certain populations also appear more likely to have abnormal baseline ECGs, including women and Black individuals.[13]
T-wave abnormalities are among the most frequently reported ECGs findings.[13] Several large surveys and systematic reviews have attempted to describe the incidence of abnormal T waves in population-based cohorts. Results from a study of patients in Angola found an incidence of T-wave inversions (TWI) ranging from 3.8% to 9.2%. Other similar studies have demonstrated a higher incidence of TWI in women compared to men in Asian and Black populations. There is also a higher incidence of abnormal T waves in patients with cardiovascular disease and diabetes.[13][14][15]
The incidence of TWI in young athletes, which may be physiologic, varies according to lead distribution. TWI in anterior precordial leads is considered a normal finding in young patients and is relatively common in young women athletes. In contrast, TWI in inferior leads (3% of healthy athletes) and lateral leads (up to 1.5%) is uncommon. The T-wave abnormalities in lateral and inferior leads are more likely to be associated with cardiomyopathy and structural heart disease and require evaluation. Lateral and inferior TWI are also more common in young Black athletes.[16]
Pathophysiology
Abnormal T-wave morphology results from disruptions in normal ventricular repolarization. The outflow of potassium from the myocyte during repolarization is necessary to restore the resting membrane potential. A complex system of ion pumps and channels in the myocardial cell membrane regulates the resting potential. During repolarization, a net efflux of positive ions that entered the cell during depolarization occurs, restoring the baseline negative resting potential and preparing the membrane for the next action potential. Disease states such as myocardial ischemia and systemic electrolyte disturbances disrupt ion transport across the cell membrane, manifesting as abnormal T waves on the ECG. Antiarrhythmic drugs may also alter T-wave morphology by acting on myocardial ion channels.[17]
Processes that alter the size or structure of the ventricular myocardium or its conducting system may also alter T-wave morphology by modifying the overall vector of myocardial action potential conduction relative to ECG leads. Such vector changes manifest as altered orientation, shape, or size of the T wave. Similarly, changes in body position (such as transitioning from a supine to an upright position or turning onto the side) may also alter the morphology of T waves.[18] Abnormalities in T-wave morphology due to acute intra-abdominal emergencies are of uncertain etiology. However, mechanisms such as visceral-cardiac reflexes, sympathetic nervous system stimulation, direct cardiotoxic effects, coagulopathy, and coronary artery spasm have been suggested.[19]
History and Physical
ECGs may be obtained for various reasons in both symptomatic and asymptomatic individuals. Upon identifying an abnormal T-wave pattern, the context should guide further evaluation. A thorough history and physical examination can provide essential information that suggests underlying pathology or indicates the presence of a T-wave variant.
History
Patients with T-wave inversions should be asked about symptoms of cardiac ischemia, such as chest pain, shortness of breath, abdominal pain, back pain, shoulder or arm pain, dizziness, nausea, sweating, and exercise intolerance. Patients with myocarditis or pericarditis may endorse similar symptoms in addition to a history of viral illness, fever, or pleuritic chest pain. Patients should also be asked about risk factors for cardiac disease, including diabetes, hypertension, hyperlipidemia, peripheral arterial disease, tobacco use, stimulant drug use, connective tissue diseases, and known structural heart disease.
T-wave abnormalities suggestive of pulmonary embolism should prompt questioning about symptoms of venous thromboembolism and associated risk factors. Patients may report chest pain, dyspnea, leg pain or swelling, lightheadedness, syncope, cough, or hemoptysis. Patients should be asked about a history of venous thromboembolism, recent prolonged immobilization, family history of coagulopathy, and history of exogenous estrogen use or smoking.
Patients with underlying renal disease should be asked about dialysis requirements and compliance, as well as changes in urination. Metabolic derangements associated with decompensated renal disease may cause T-wave abnormalities. Moreover, a thorough medication history should be obtained because drugs such as digoxin and other antiarrhythmics may alter T-wave morphology.[20] For young, otherwise healthy patients undergoing an ECG for screening, a thorough family history should be obtained to screen for inherited structural heart disease, channelopathies, and sudden unexpected deaths.
Physical Examination
The physical examination in patients with abnormal T waves may range from deceptively unremarkable to frank hemodynamic collapse or cardiac arrest. Examination findings vary based on the underlying pathology and its severity. The physical examination should first prioritize identifying evidence of hemodynamic instability or end-organ dysfunction.
Patients with acute myocardial ischemia, massive pulmonary embolism, or decompensated structural heart disease with congestive heart failure may exhibit abnormal vital signs, altered mental status, respiratory distress, or evidence of pulmonary or systemic volume overload. Patients with abnormal T waves due to subarachnoid or intracranial hemorrhage may present with altered mental status, focal neurologic deficits, or coma. A pericardial friction rub may be auscultated in patients with pericarditis. Various cardiac murmurs may be auscultated in patients with structural and valvular heart disease, states of volume overload, or myocardial infarction.
Patients with significant hyperkalemia may also manifest hemodynamic instability and dysrhythmias. Because patients with hyperkalemia often have underlying renal disease, they should be examined for the presence and function of hemodialysis access sites and physical manifestations of uremia. Patients with intra-abdominal emergencies may have vital sign instability, abdominal distension or tenderness, and vomiting. Otherwise healthy patients with juvenile T waves, chronic bundle branch block, or controlled arrhythmias on digoxin or other antiarrhythmic medications may have relatively normal physical examination findings.
Evaluation
Abnormal T-wave ECG findings should always correlate with the patient's symptoms, examination findings, and medical history. Findings should also be compared with prior ECGs to evaluate stability over time. Asymptomatic individuals with juvenile T waves or other normal variants may not require immediate further testing. Those asymptomatic with stable T-wave abnormalities may not require immediate testing, particularly if prior evaluations are available. The assessment of abnormal T-wave findings on ECG should be individualized, based on the suspected underlying pathology, presenting symptoms, acuity of presentation, and comparison to prior ECGs.
Further laboratory testing and imaging should be based on the suspected underlying pathology. For example, patients with suspected myocardial ischemia require a complete blood count, basic metabolic panel, cardiac biomarkers, and serial ECGs to determine the next action. A basic metabolic panel is also crucial for patients with T-wave abnormalities suggestive of hyperkalemia. Computed tomography of the brain may be necessary to assess for possible subarachnoid hemorrhage, intracranial hemorrhage, or other intracranial mass lesions in the setting of cerebral T-wave abnormalities.
Echocardiography may benefit patients with suspected structural heart disease or valvular disease. Imaging the pulmonary arteries via contrast-enhanced computed tomography angiography of the chest or a ventilation-perfusion scan may confirm the diagnosis of pulmonary embolism in patients with suggestive ECG changes. Patients with suspected intra-abdominal emergencies should undergo a complete blood count, basic metabolic panel, liver function tests, lipase levels, urinalysis, and abdominal imaging, guided by the suspected underlying pathology and the patient's hemodynamic stability.
Treatment / Management
Treatment varies with the etiology of the T-wave changes. Some T-wave abnormalities or normal variants do not require intervention. However, some causes of T-wave changes are associated with high morbidity and mortality without emergent intervention.
Ischemia and Infarction
If acute T waves suggest ischemia in a coronary artery distribution, management should prioritize reperfusion and treatment of the acute coronary syndrome. Treatment may include antiplatelet agents, percutaneous coronary intervention, thrombolysis, or coronary artery bypass grafting. Coronary artery spasm may be managed acutely with nitrates or calcium channel blockers.[21]
Hyperkalemia
Patients with ECG abnormalities and clinical history suggestive of hyperkalemia, such as peaked T waves, require emergent treatment. Intravenous administration of calcium chloride or calcium gluconate helps stabilize myocardial cell membranes, thereby decreasing the risk of malignant arrhythmias, while other therapies are administered to reduce serum potassium concentrations. These treatments include inhaled β-agonists and intravenous insulin with intravenous dextrose to shift serum potassium into the intracellular space. Loop and thiazide diuretics promote renal potassium excretion.
Gastrointestinal cation exchangers, such as sodium polystyrene sulfonate or sodium zirconium cyclosilicate, may promote gastrointestinal potassium excretion but pose a risk of significant harm and may not provide substantial clinical benefit. Finally, hemodialysis may treat hyperkalemia refractory to other therapies or in patients with end-stage renal disease with or without anuria. Please see StatPearls' companion resource, "Hyperkalemia," for further information.[22]
Pulmonary Embolism
Depending on the overall clot burden and the extent of associated hemodynamic compromise, treating pulmonary emboli causing T-wave abnormalities on ECG may involve oral or intravenous systemic anticoagulation, systemic thrombolysis, catheter-directed tissue plasminogen activator therapy, or clot retrieval.[23] Institutional protocols and pulmonary embolism response teams should be implemented to optimize patient outcomes.[24](B3)
Pericarditis and Myocarditis
Treatment of acute pericarditis and myocarditis depends on the underlying etiology. Treatment of pericarditis typically involves several weeks of oral anti-inflammatory medications, such as ibuprofen or aspirin, in addition to 3 months of oral colchicine therapy. Pericarditis and myocarditis due to autoimmune disease may require additional immunomodulatory agents. In rare viral or bacterial pericarditis and myocarditis cases, targeted therapies may require systemic antiviral or antibacterial treatments, depending on the underlying etiology and specialist recommendations.[25] Corticosteroids are generally not recommended as a first-line treatment option for acute pericarditis.[26](B2)
Intra-abdominal Emergencies
Patients with T-wave abnormalities due to acute cholecystitis, gastric or bowel perforation, bowel obstruction, or other surgical emergencies require a surgical consultation in addition to standard interventions for the underlying pathology (eg, broad-spectrum antibiotics, nasogastric tube decompression, fluid resuscitation).
Drug-Drug Interaction or Intoxication
T-wave abnormalities due to drug toxicity or intoxication should be differentiated from expected ECG changes due to therapeutic use. Drug levels should be obtained when indicated. In cases of cardiac toxicity, reversal agents should be administered when available according to standard guidelines. For example, cases of cardiac digoxin toxicity require administration of digoxin-specific antibodies.[20]
Differential Diagnosis
The differential diagnoses for ECG T waves include the following:
T-Wave Inversion
- Normal variant
- Myocardial ischemia
- Ventricular strain (pulmonary embolism, pulmonary hypertension, or severe systemic hypertension)
- Cerebrovascular injury
- Hypertrophic cardiomyopathy
- Takotsubo cardiomyopathy
- Left bundle branch block
- Right bundle branch block
- Ventricular beats
- Papillary muscle hypertrophy or displacement [16]
- Medication or illicit drug use (digoxin, class I and III antiarrhythmic agents, psychotropic drugs, antidepressants)
- Cardiac memory secondary to transient tachycardia
- Maxillofacial surgery
- Bilateral carotid endarterectomy
- Acute gastrointestinal pathology (perforated gastric ulcer, acute cholecystitis, intestinal obstruction, pancreatitis) [9][19]
- Idiopathic
Peaked T waves
- Normal variant
- Benign early repolarization
- Hyperacute phase of myocardial infarction
- De Winter T waves
- Prinzmetal angina
- Hyperkalemia
- Left ventricular hypertrophy
- Left bundle branch block
- Acute pericarditis [5]
Biphasic T waves
- Myocardial ischemia
- Hypokalemia
Prognosis
The prognosis depends primarily on the underlying etiology. T-wave abnormalities identified on ECG may be benign or represent severe, life-threatening conditions. The ECG and a thorough history and physical examination provide valuable information about etiology and prognosis. Young patients with T-wave inversion in inferior or lateral leads are more likely to have underlying structural heart disease. They should undergo further diagnostic testing and activity modification until cleared by a cardiologist to decrease the risk of arrhythmia and sudden cardiac death.
Complications
The T-wave abnormalities associated with serious underlying pathology require prompt intervention to prevent complications. Failure to correctly identify T-wave abnormalities due to myocardial ischemia or myocarditis may lead to unrecognized myocardial infarction, cardiogenic shock, ischemic cardiomyopathy, acute valvular dysfunction, cardiac tamponade, and death. Failure to recognize cardiac strain from massive pulmonary embolism or decompensated pulmonary or systemic hypertension may also lead to cardiogenic shock and death. Peaked T waves associated with hyperkalemia may precipitate arrhythmias and cardiac arrest. Proper identification of normal T-wave variants prevents unnecessary evaluation and intervention and reduces the risk of iatrogenic injury.
Consultations
The underlying pathology should guide consultations with specialists. Cardiology should be consulted for patients with primary cardiac diseases such as unstable angina, non–ST–elevation myocardial infarction, ST-elevation myocardial infarction, myocarditis, and hemodynamically significant arrhythmias. Patients with underlying valvular or congenital heart disease may benefit from consultation with cardiology or cardiothoracic surgery, depending on the lesion and acuity of the presentation.
Patients with T-wave abnormalities from electrolyte derangements secondary to renal disease benefit from nephrology consultation. Other situations in which consultation may be warranted include cases of acute massive pulmonary embolism (interventional radiology, pulmonology, or critical care), drug toxicity (toxicology, nephrology, or cardiology), cerebral hemorrhage or ischemia (neurology or neurosurgery), or intra-abdominal surgical emergencies (general surgery). Patients with hemodynamic instability may require intensive care unit admission and critical care consultation.
Deterrence and Patient Education
Certain disease states associated with T-wave abnormalities may be prevented. For example, risk factors for ischemic heart disease and renal disease, including hypertension, diabetes mellitus, hyperlipidemia, and drug or alcohol use, may be addressed with lifestyle modifications or medications. Patients with congenital heart disease, valvular disease, or other structural abnormalitiess may be candidates for pharmacologic or surgical intervention to address pathologic cardiac remodeling or disturbances in electrical conduction. Patients at high risk for pulmonary embolism may recieve short-term or lifelong anticoagulation to prevent recurrences.
Enhancing Healthcare Team Outcomes
Patients with abnormal T waves on ECG may have serious underlying pathology requiring timely intervention for optimal outcomes. Healthcare team members must be familiar with the range of pathologies associated with an abnormal T wave and communicate these findings within the interprofessional team. The ECG is typically performed by technicians or nursing staff. Prompt ECG performance and delivery to the responsible clinicians are critical for time-sensitive disease processes such as myocardial ischemia, massive pulmonary embolism, and hyperkalemia.
Telemetry technicians and nurses may also identify T-wave abnormalities on continuous cardiac monitoring and must report such abnormalities to the responsible clinicians. Clinicians ordering ECGs must be adept at interpreting abnormal T-wave morphology and contacting the appropriate specialists when indicated. Clinicians should also be able to identify the range of normal T-wave variants and communicate these findings to team members. Coordination and communication among healthcare team members are essential to optimizing patient outcomes.
Media
(Click Image to Enlarge)
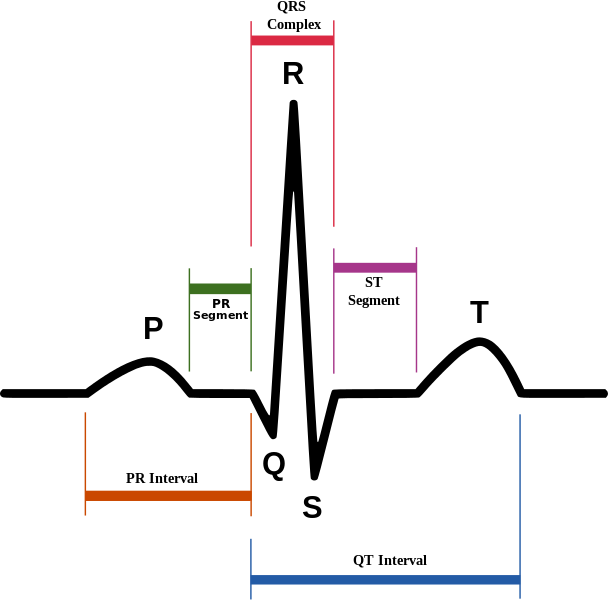
Normal Sinus Rhythm on Electrocardiography. Schematic diagram of normal sinus rhythm on electrocardiography. The P wave, QRS complex, T wave, and PR and ST segments are normal.
Agateller (Anthony Atkielski), Public Domain, via Wikimedia Commons
(Click Image to Enlarge)
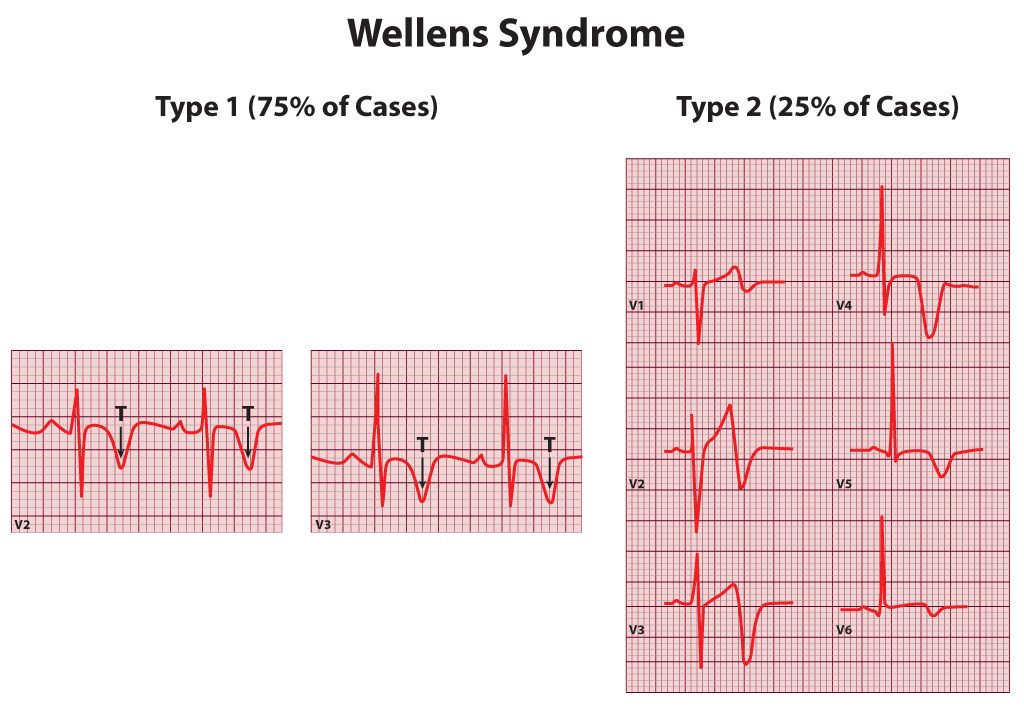
Wellens Syndrome. Wellens syndrome, including type 1 and type 2.
Contributed by B Parker
(Click Image to Enlarge)
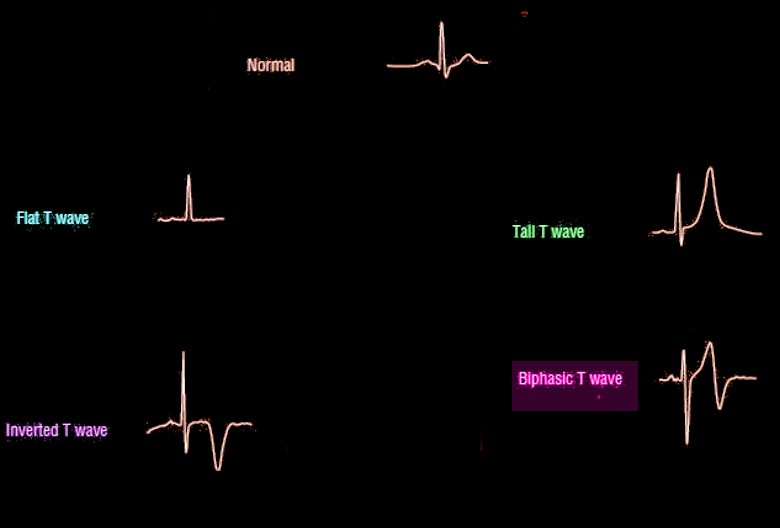
T-Wave Morphology. A comparison of different T-wave morphologies on an electrocardiogram: Normal, Flat, Inverted, Tall, and Biphasic. These variations from the normal, upright, rounded T wave are clinically significant, often suggesting underlying conditions such as ischemia or electrolyte imbalance.
Contributed by S Bhimji, MD
(Click Image to Enlarge)
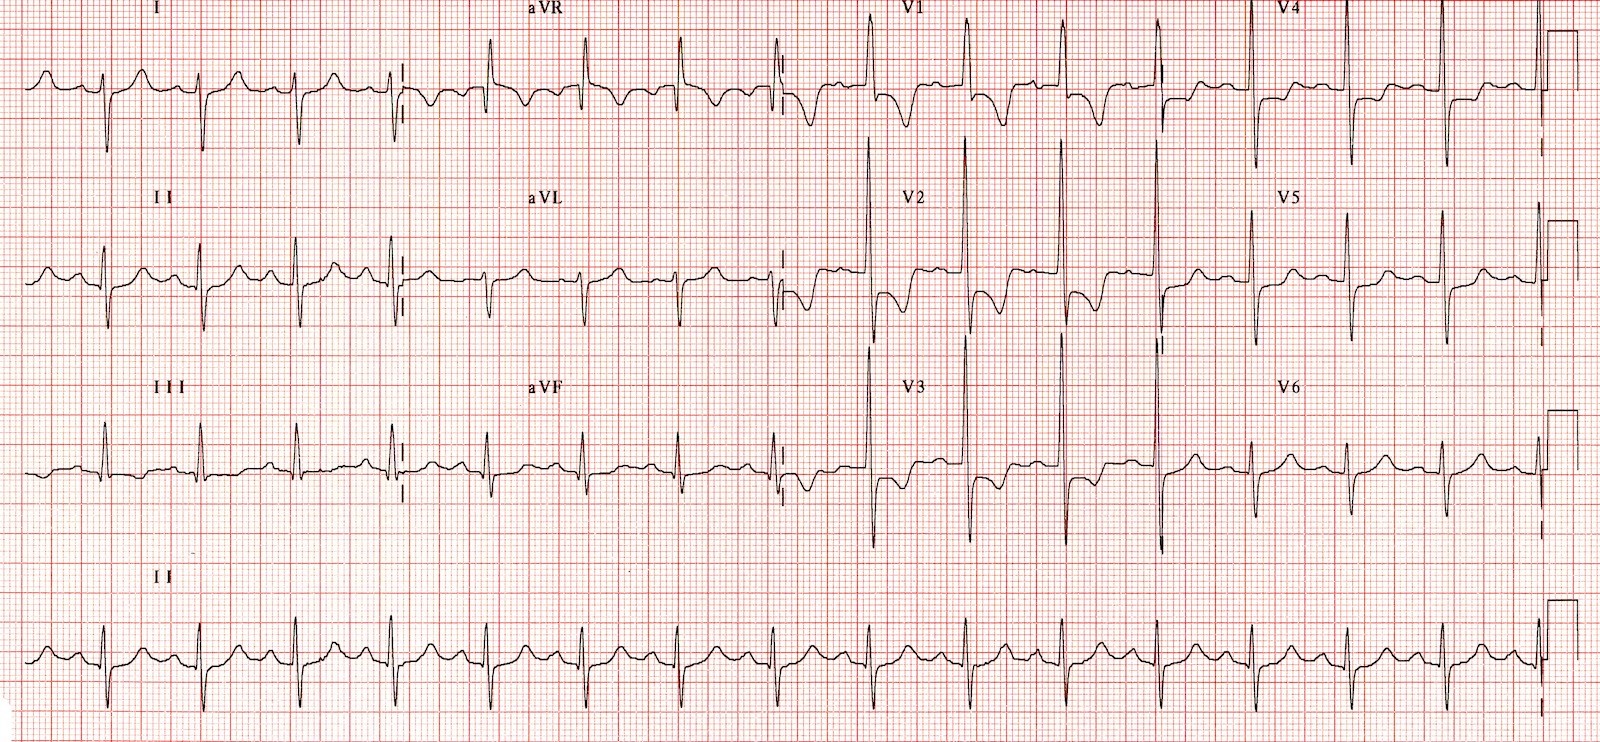
Right Ventricular Hypertrophy Electrocardiography. Note the tall QRS complex in leads V₁ through V₄. The combination of a negative QRS deflection in lead I and a positive QRS deflection in lead aVF suggests right axis deviation. ST-T wave abnormalities in leads II, III, and aVF indicate right ventricular strain.
Contributed by P Bhattacharya, MD
References
Levis JT. ECG Diagnosis: Hyperacute T Waves. The Permanente journal. 2015 Summer:19(3):79. doi: 10.7812/TPP/14-243. Epub [PubMed PMID: 26176573]
Becker DE. Fundamentals of electrocardiography interpretation. Anesthesia progress. 2006 Summer:53(2):53-63; quiz 64 [PubMed PMID: 16863387]
Smith SW, Meyers HP. Hyperacute T-waves Can Be a Useful Sign of Occlusion Myocardial Infarction if Appropriately Defined. Annals of emergency medicine. 2023 Aug:82(2):203-206. doi: 10.1016/j.annemergmed.2023.01.011. Epub 2023 Mar 3 [PubMed PMID: 36872197]
Hancock EW. Normal ECG or peaked T waves? Hospital practice (1995). 1998 May 15:33(5):19-20 [PubMed PMID: 9606350]
Level 3 (low-level) evidenceSomers MP, Brady WJ, Perron AD, Mattu A. The prominent T wave: electrocardiographic differential diagnosis. The American journal of emergency medicine. 2002 May:20(3):243-51 [PubMed PMID: 11992348]
Level 3 (low-level) evidenceLevis JT. ECG diagnosis: hyperkalemia. The Permanente journal. 2013 Winter:17(1):69. doi: 10.7812/TPP/12-088. Epub [PubMed PMID: 23596374]
Level 3 (low-level) evidenceAlexander J, Rizzolo D. Wellens syndrome: An important consideration in patients with chest pain. JAAPA : official journal of the American Academy of Physician Assistants. 2023 Feb 1:36(2):25-29. doi: 10.1097/01.JAA.0000911188.18646.31. Epub [PubMed PMID: 36701576]
Khandaker MH, Espinosa RE, Nishimura RA, Sinak LJ, Hayes SN, Melduni RM, Oh JK. Pericardial disease: diagnosis and management. Mayo Clinic proceedings. 2010 Jun:85(6):572-93. doi: 10.4065/mcp.2010.0046. Epub [PubMed PMID: 20511488]
Said SA, Bloo R, de Nooijer R, Slootweg A. Cardiac and non-cardiac causes of T-wave inversion in the precordial leads in adult subjects: A Dutch case series and review of the literature. World journal of cardiology. 2015 Feb 26:7(2):86-100. doi: 10.4330/wjc.v7.i2.86. Epub [PubMed PMID: 25717356]
Level 2 (mid-level) evidenceD'Ascenzi F, Anselmi F, Adami PE, Pelliccia A. Interpretation of T-wave inversion in physiological and pathological conditions: Current state and future perspectives. Clinical cardiology. 2020 Aug:43(8):827-833. doi: 10.1002/clc.23365. Epub 2020 Apr 7 [PubMed PMID: 32259342]
Level 3 (low-level) evidenceShvilkin A, Huang HD, Josephson ME. Cardiac memory: diagnostic tool in the making. Circulation. Arrhythmia and electrophysiology. 2015 Apr:8(2):475-82. doi: 10.1161/CIRCEP.115.002778. Epub [PubMed PMID: 25900990]
Arisha MJ, Belcher A, Annie F, Mian MS. Wellens syndrome progressing from a very subtle type A to a classic type B Wellens pattern. Cardiovascular revascularization medicine : including molecular interventions. 2023 Dec:57():93-95. doi: 10.1016/j.carrev.2023.05.009. Epub 2023 May 23 [PubMed PMID: 37330335]
Prineas RJ, Le A, Soliman EZ, Zhang ZM, Howard VJ, Ostchega Y, Howard G, Reasons for Geographic and Racial Differences in Stroke (REGARDS) Investigators. United States national prevalence of electrocardiographic abnormalities in black and white middle-age (45- to 64-Year) and older (≥65-Year) adults (from the Reasons for Geographic and Racial Differences in Stroke Study). The American journal of cardiology. 2012 Apr 15:109(8):1223-8. doi: 10.1016/j.amjcard.2011.11.061. Epub 2012 Jan 14 [PubMed PMID: 22245412]
Gonçalves MAA, Pedro JM, Silva C, Magalhães P, Brito M. Prevalence of major and minor electrocardiographic abnormalities and their relationship with cardiovascular risk factors in Angolans. International journal of cardiology. Heart & vasculature. 2022 Apr:39():100965. doi: 10.1016/j.ijcha.2022.100965. Epub 2022 Feb 9 [PubMed PMID: 35198725]
Cardona A, Zareba KM, Nagaraja HN, Schaal SF, Simonetti OP, Ambrosio G, Raman SV. T-Wave Abnormality as Electrocardiographic Signature of Myocardial Edema in Non-ST-Elevation Acute Coronary Syndromes. Journal of the American Heart Association. 2018 Jan 26:7(3):. doi: 10.1161/JAHA.117.007118. Epub 2018 Jan 26 [PubMed PMID: 29432131]
Palermi S, Tardini L, Graziano F, Bianco M, Bina A, Castelletti S, Cavarretta E, Contursi M, Corrado D, D'Ascenzi F, Inama G, Mos L, Pelliccia A, Palamà Z, Scarà A, Sciarra L, Sollazzo F, Patrizi G, Vessella T, Zorzi A. Interpretation and management of T wave inversion in athletes: An expert opinion statement of the Italian Society of Sports Cardiology (SICSPORT). International journal of cardiology. 2025 Mar 1:422():132968. doi: 10.1016/j.ijcard.2025.132968. Epub 2025 Jan 5 [PubMed PMID: 39765321]
Level 3 (low-level) evidenceKrijger Juárez C, Amin AS, Offerhaus JA, Bezzina CR, Boukens BJ. Cardiac Repolarization in Health and Disease. JACC. Clinical electrophysiology. 2023 Jan:9(1):124-138. doi: 10.1016/j.jacep.2022.09.017. Epub 2022 Nov 30 [PubMed PMID: 36697193]
Radbill AE, Lei LY, Paranjape SY, Blackwell DJ, Abraham RL, Chew DS, Raj SR, Knollmann BC. Assessment of dynamic cardiac repolarization and contractility in patients with hypertrophic cardiomyopathy. PloS one. 2021:16(2):e0246768. doi: 10.1371/journal.pone.0246768. Epub 2021 Feb 11 [PubMed PMID: 33571287]
Armas CD, Bademian S, Kcomt M, Burgess J, Qiao X. No small dilemma: small bowel volvulus mimicking acute coronary syndrome. Oxford medical case reports. 2024 Jul:2024(7):omae080. doi: 10.1093/omcr/omae080. Epub 2024 Jul 30 [PubMed PMID: 39087087]
Level 2 (mid-level) evidenceMansour MJ, Kalaoui M, Chammas E, Hamoui O, Fawaz T, AlJaroudi WA. Unusual digoxin toxicity with myocardial injury. Journal of electrocardiology. 2017 Nov-Dec:50(6):909-911. doi: 10.1016/j.jelectrocard.2017.07.013. Epub 2017 Jul 12 [PubMed PMID: 28807352]
Gudbjartsson T, Andersen K, Danielsen R, Geirsson A, Thorgeirsson G. [Review on coronary artery disease - part I: epidemiology, pathophysiology, clinical presentation and work-up]. Laeknabladid. 2014 Dec:100(12):667-76. doi: 10.17992/lbl.2014.12.572. Epub [PubMed PMID: 25519463]
Bockenhauer D, Zieg J. Electrolyte disorders. Clinics in perinatology. 2014 Sep:41(3):575-90. doi: 10.1016/j.clp.2014.05.007. Epub 2014 Jul 18 [PubMed PMID: 25155728]
Sista AK, Kuo WT, Schiebler M, Madoff DC. Stratification, Imaging, and Management of Acute Massive and Submassive Pulmonary Embolism. Radiology. 2017 Jul:284(1):5-24. doi: 10.1148/radiol.2017151978. Epub [PubMed PMID: 28628412]
Zern EK, Young MN, Rosenfield K, Kabrhel C. A Pulmonary Embolism Response Team: initial experiences and future directions. Expert review of cardiovascular therapy. 2017 Jun:15(6):481-489. doi: 10.1080/14779072.2017.1337509. Epub 2017 Jun 5 [PubMed PMID: 28571513]
Level 3 (low-level) evidenceWelch TD. Constrictive pericarditis: diagnosis, management and clinical outcomes. Heart (British Cardiac Society). 2018 May:104(9):725-731. doi: 10.1136/heartjnl-2017-311683. Epub 2017 Nov 25 [PubMed PMID: 29175978]
Level 2 (mid-level) evidenceWang TKM, Klein AL, Cremer PC, Imazio M, Kohnstamm S, Luis SA, Mardigyan V, Mukherjee M, Ordovas K, Vakamudi S, Wohlford GF. 2025 Concise Clinical Guidance: An ACC Expert Consensus Statement on the Diagnosis and Management of Pericarditis: A Report of the American College of Cardiology Solution Set Oversight Committee. Journal of the American College of Cardiology. 2025 Dec 23:86(25):2691-2719. doi: 10.1016/j.jacc.2025.05.023. Epub 2025 Aug 6 [PubMed PMID: 40767817]
Level 3 (low-level) evidence